When you first open up the menu to view a time series plot (the graphs), the default time period is this and you need to use the increase and decrease buttons to display the data:
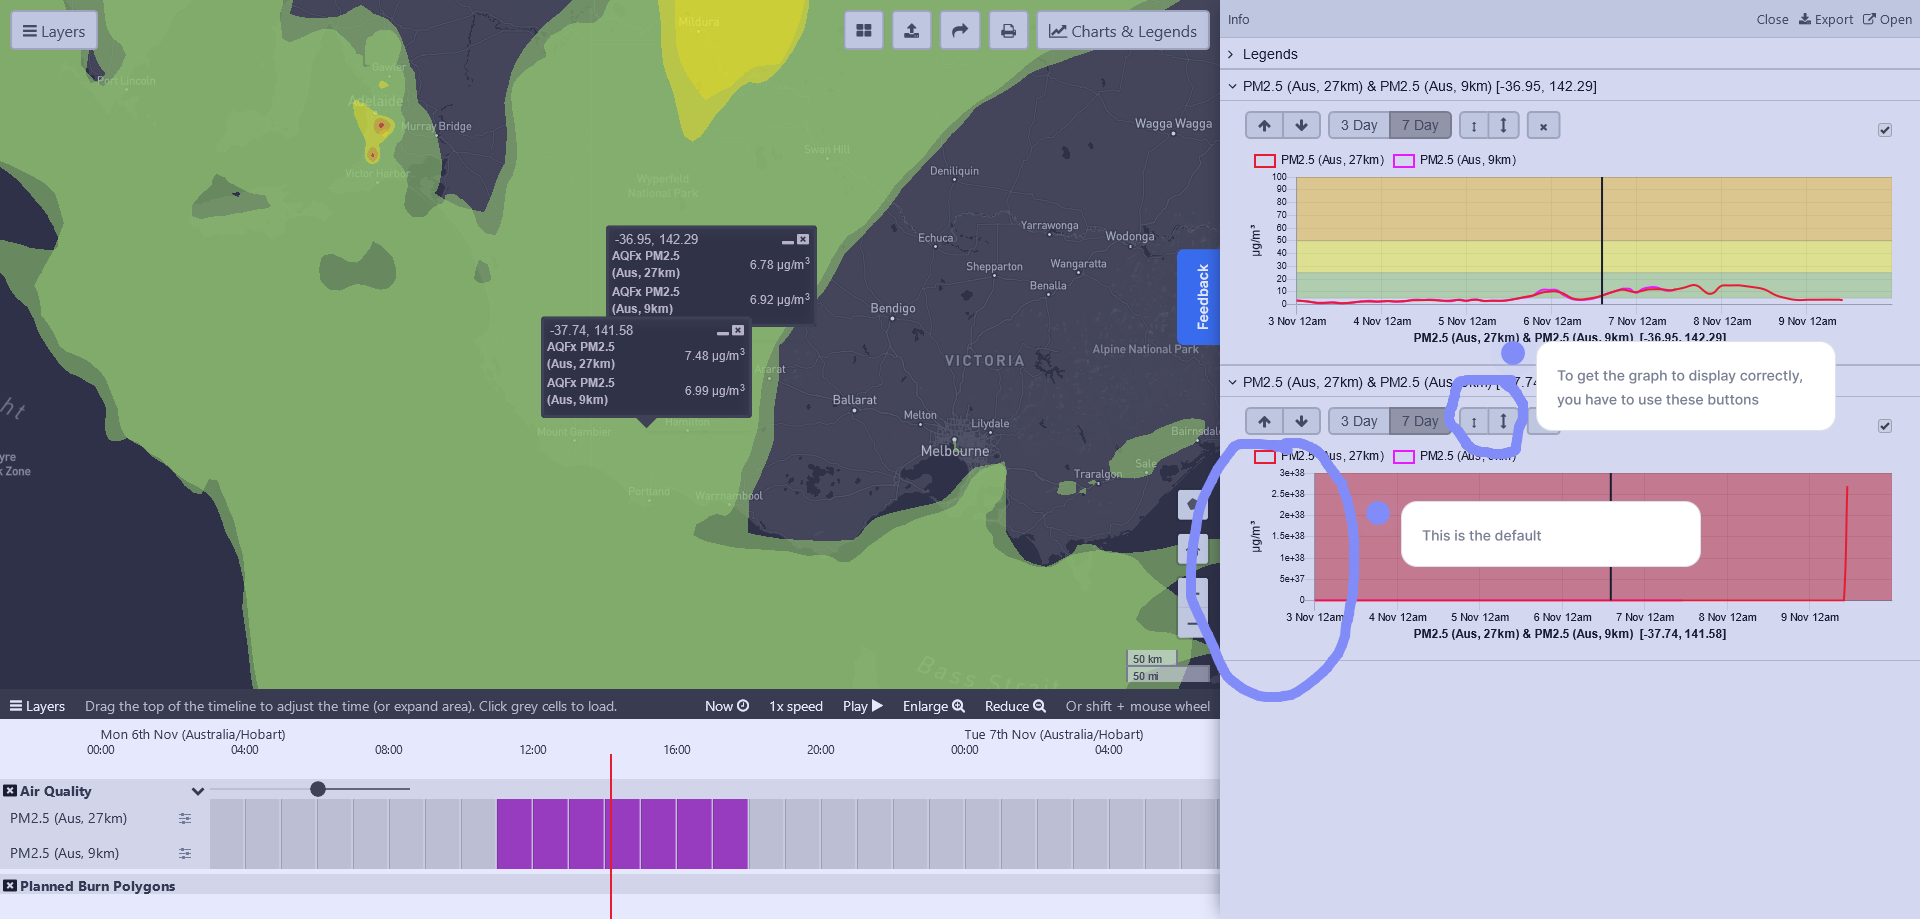
When you first open up the menu to view a time series plot (the graphs), the default time period is this and you need to use the increase and decrease buttons to display the data:
Please authenticate to join the conversation.
Investigating
🐛 Bug Report
Low Priority
Almost 3 years ago
Get notified by email when there are changes.
Investigating
🐛 Bug Report
Low Priority
Almost 3 years ago
Get notified by email when there are changes.