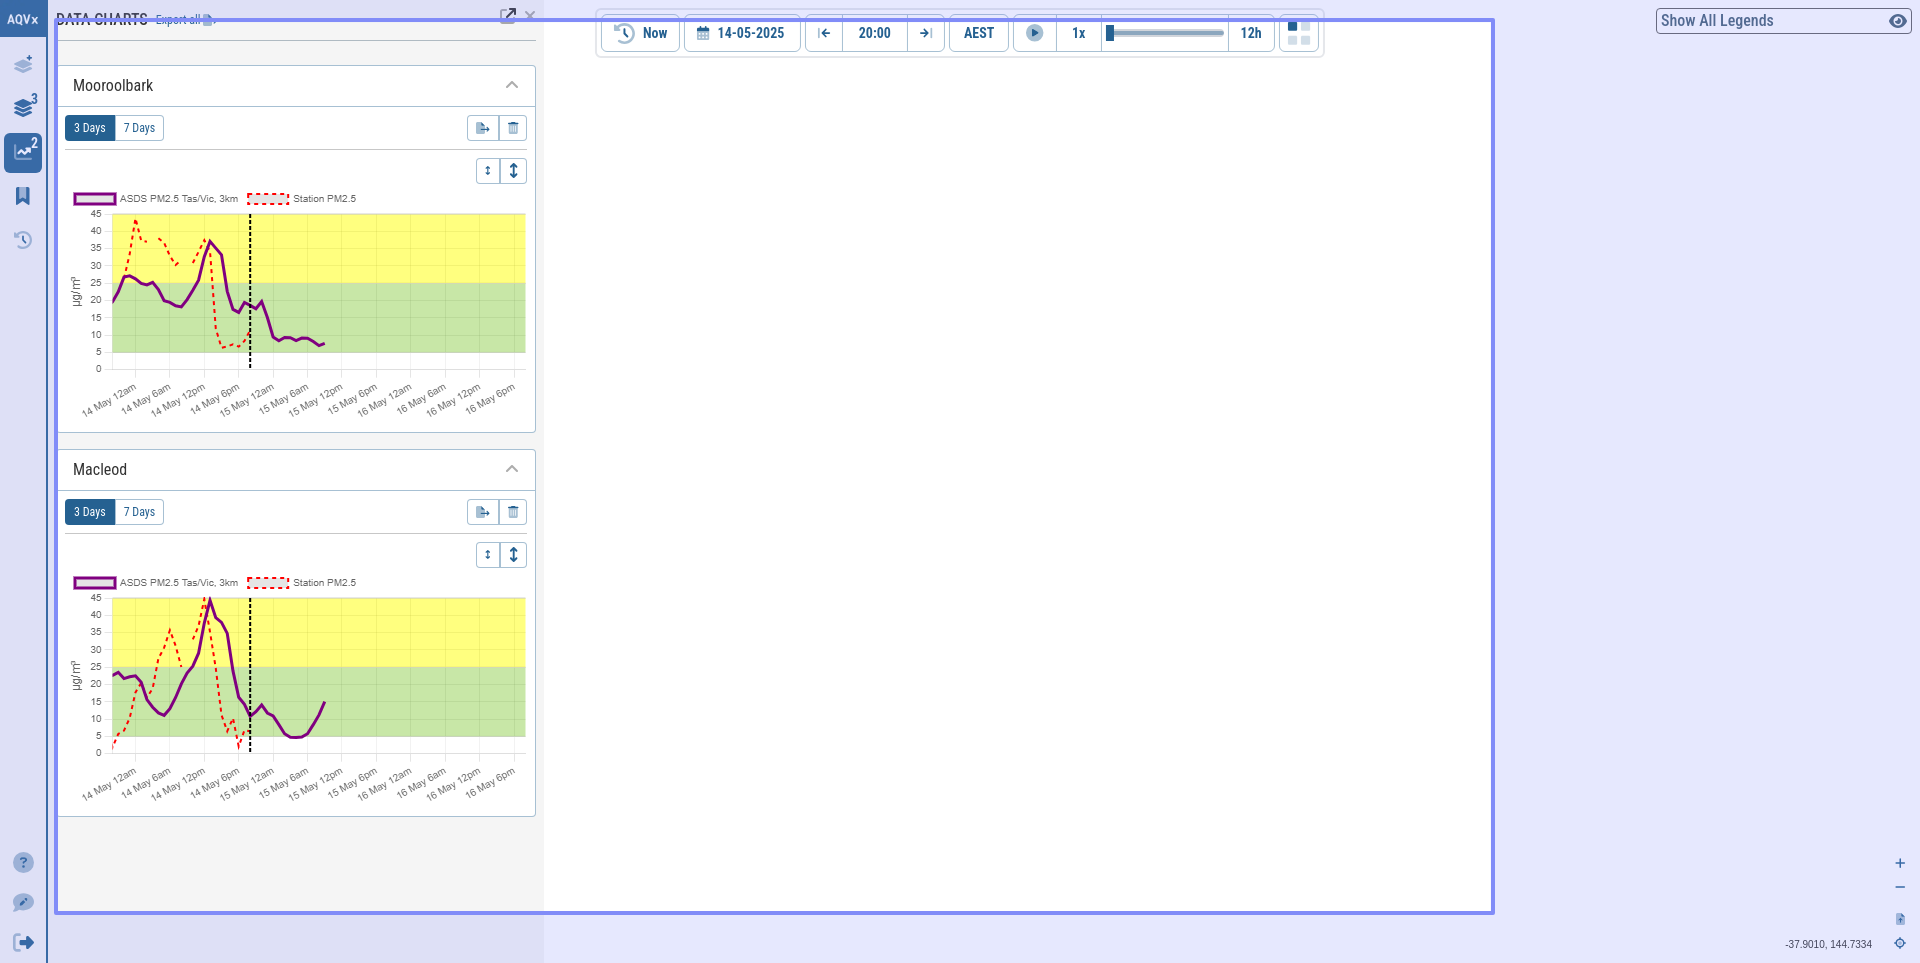
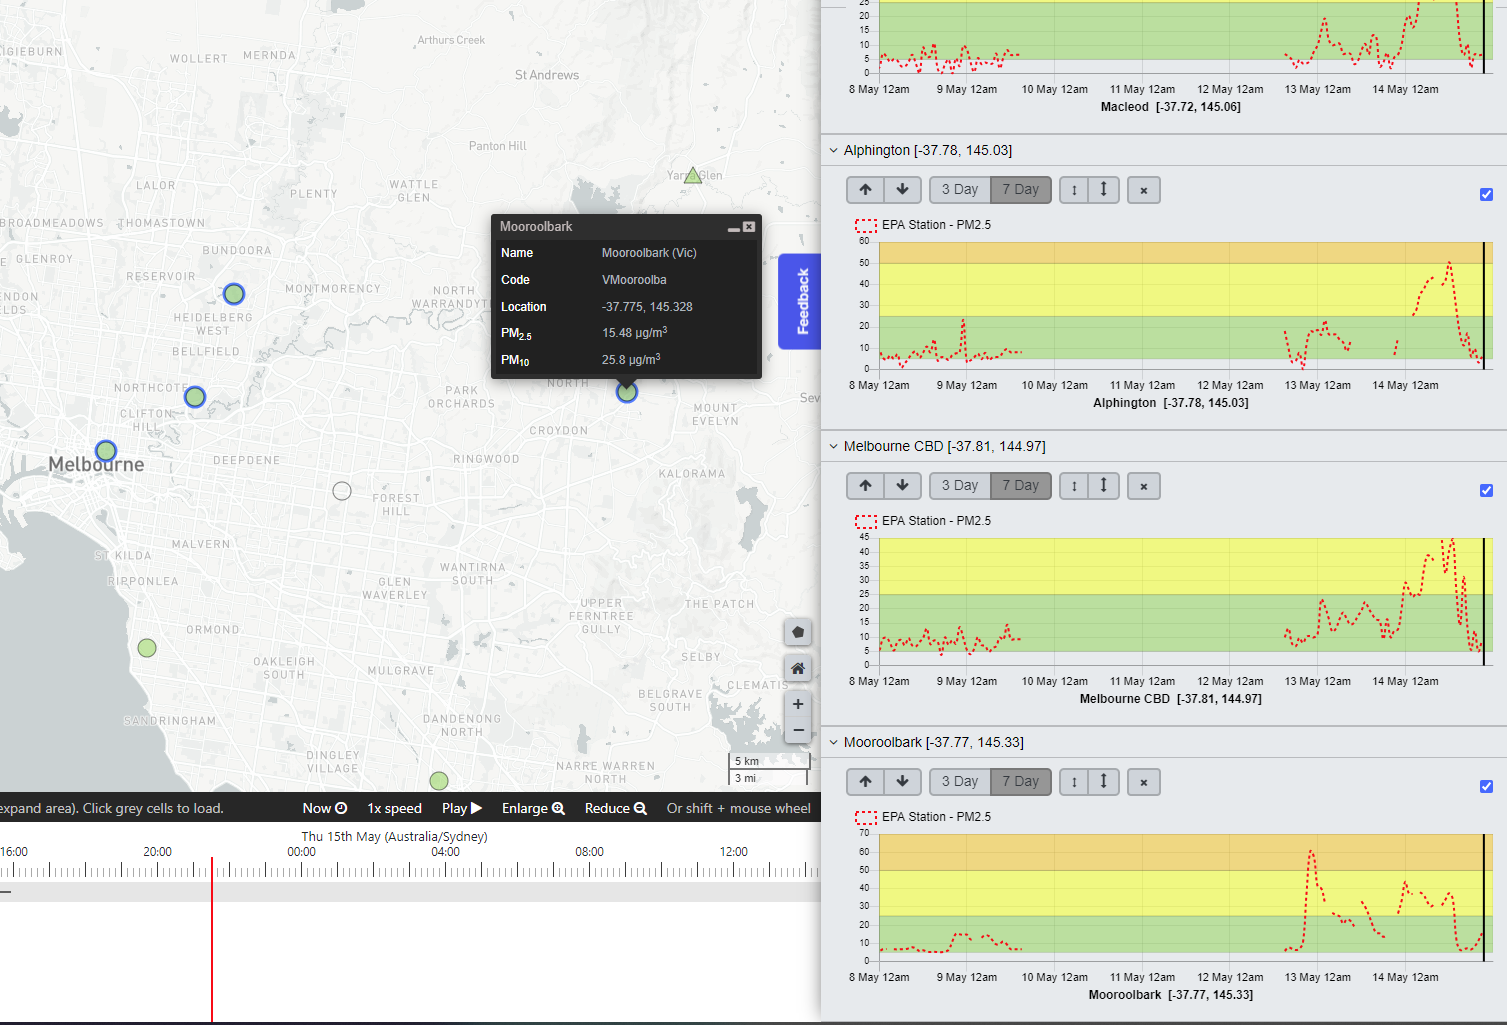
The Government sensors dont stay selected even though the graphs are still shown. This worked really well in the odl version with the ability to minimise and remove the points easily and the stations selected have a blue line to show they are still selected.
Also the graph y scale matched the data range in the old version but loads up with a the graph empty in the new version. Can the graphs be loaded with the selected time close to the right with only the space for a a day or 2 of forecast. Can this please match was occurs in the old version please?