Difficult to see some lines on graphs
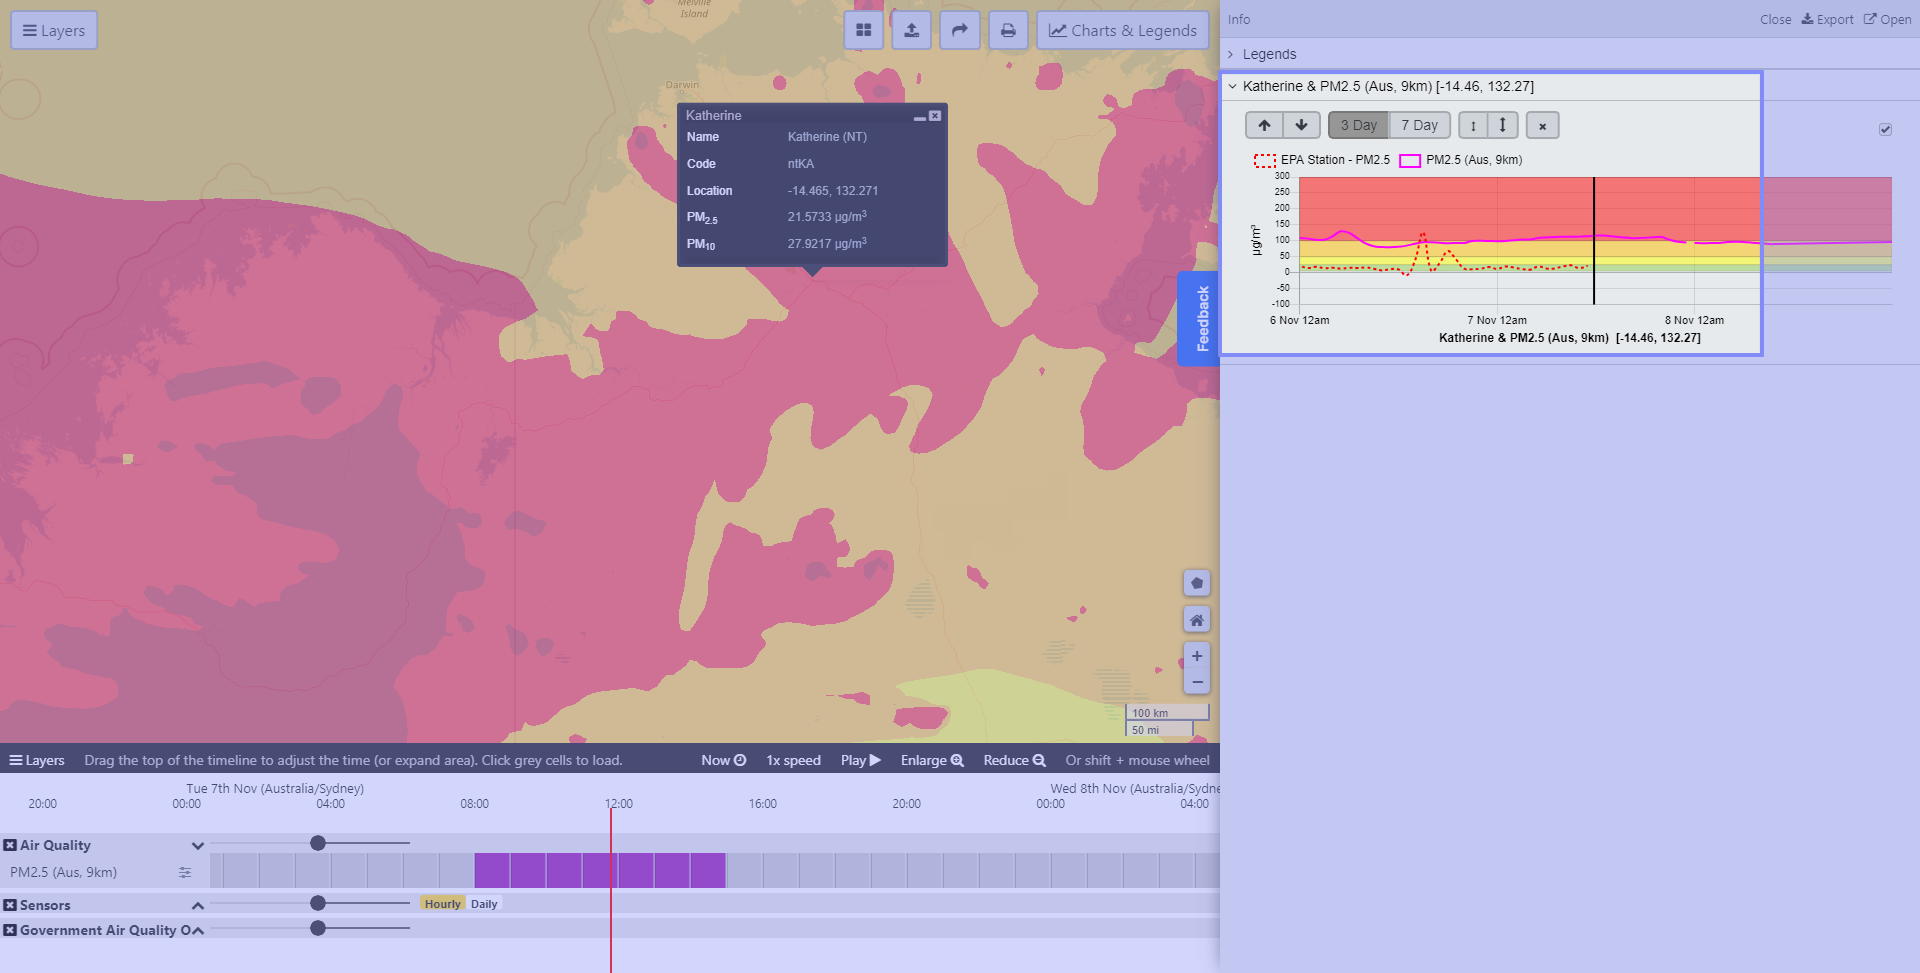
It is difficult to see the sensor lines on graphs as they can be red over a red background. Can we make the sensors and AQ observations dark blue or black please? Also the colours of pink or red for smoke forecasts might not work well either.
Status: Investigating
Log in to comment and vote
No comments yet
Be the first to share your thoughts.