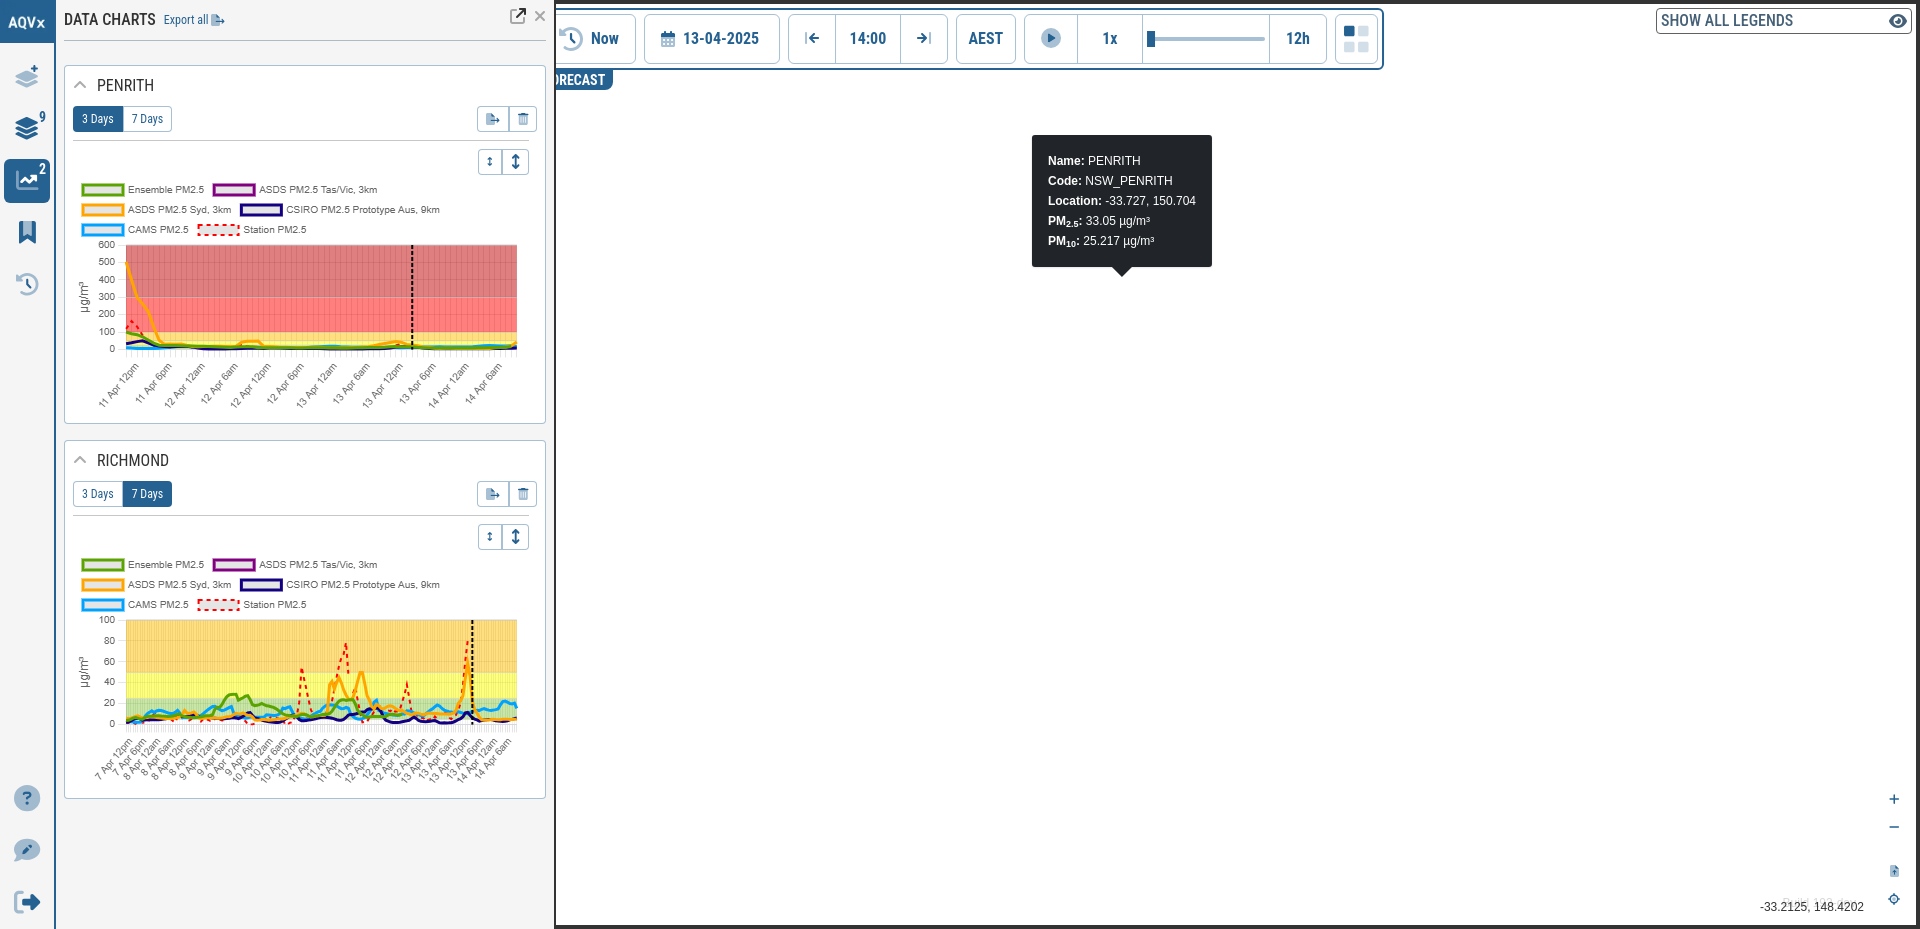
Change in range of plot🐛Bug ReportApr 13, 2025Here a second time series plot has been generated, however the y-axis range selection arrows no longer seem to work (still works on the other plot)Status: Completed1 comment1
Log in to comment and vote
Comments1
Matt Sawkill
Apr 16, 2025
https://portableaustralia.atlassian.net/browse/AQVX-69